User Interface
Insight is organized around the development tasks you perform while validating a vision application: inspect files, prepare media, start sources, view output, and watch runtime health.
Workspace
The Workspace view lets you browse the project files visible to Insight. In the Neat Development Environment, this is normally /workspace; outside the SDK, Insight falls back to the current working directory.
Use Workspace to:
- Search and browse source files, configuration, model artifacts, and generated outputs.
- Preview text, code, Markdown, images, and selected binary artifacts.
- Inspect MPK package archives without manually extracting them.
- View specialized development artifacts such as MLA stats, MPK manifests, and pipeline sequence files.
Workspace is especially useful when an application produces several build outputs and logs. It gives you a browser-accessible way to inspect those artifacts while staying in the same development session.

Media Sources
Media Sources is where you add and manage media files used for application tests. Select Import Media to open the import dialog, then choose one of three sources:
- Local files: Choose or drag and drop one or more files from your computer. H.264 MP4 uploads are normalized for low-latency playback with B-frames disabled while preserving the source frame rate.
- Catalog: Import from SiMa's curated video catalog for repeatable tests with known assets. Browse by asset type or name, search the catalog, filter by resolution, frame rate, and codec, preview a video, then import one variant or select and import several matching assets.
- YouTube: Paste a regular YouTube video URL, validate it to display a preview, and choose a start time, clip length, and output profile. Insight supports 1-, 3-, or 5-minute clips at
1080p30,720p30, or480p30. The imported clip is converted to WebRTC-friendly H.264 with B-frames disabled. Active live streams are not supported; use a regular video or an archived live stream.
Catalog and YouTube imports require network access. Insight displays progress while it downloads and prepares the media, then saves the result in the local media library.
Supported video formats include common container formats such as mp4, mov, avi, mkv, and webm. Insight also recognizes MJPEG assets and HEVC/H.265 media for codec-aware streaming. MJPEG and HEVC media are preserved so they can be streamed with their original codec behavior.
After importing media, you can filter the file list, preview a selected file, inspect its basic metadata, or delete files that are no longer needed. Use Media Sources before configuring streaming sources so you know which files are available, which codec Insight detected, and whether they are readable.
The Video files card shows the library as folders. Folder rows open the folder and list its subfolders and videos. Each folder row shows how many streamable videos it holds, its subfolders included, and the count beside the Video files heading shows the same for the folder you are in. The breadcrumb shows where you are; click any part of it, Videos included, to go back up to that level. The filter searches the current folder and everything beneath it and shows matches with their path relative to the current folder. Files Insight cannot stream are listed greyed with a Not streamable tag so you can still preview or delete them; the assign dialog in Streaming Sources hides them and greys out folders without a streamable video. Folder names are ordinary labels you choose, for example 30FPS/ or 120FPS-720p-h264/; Insight never reads video settings from them. In the Neat SDK the library lives at /workspace/.insight-media/, so it survives SDK restarts. Uploads always land at the top of the library.
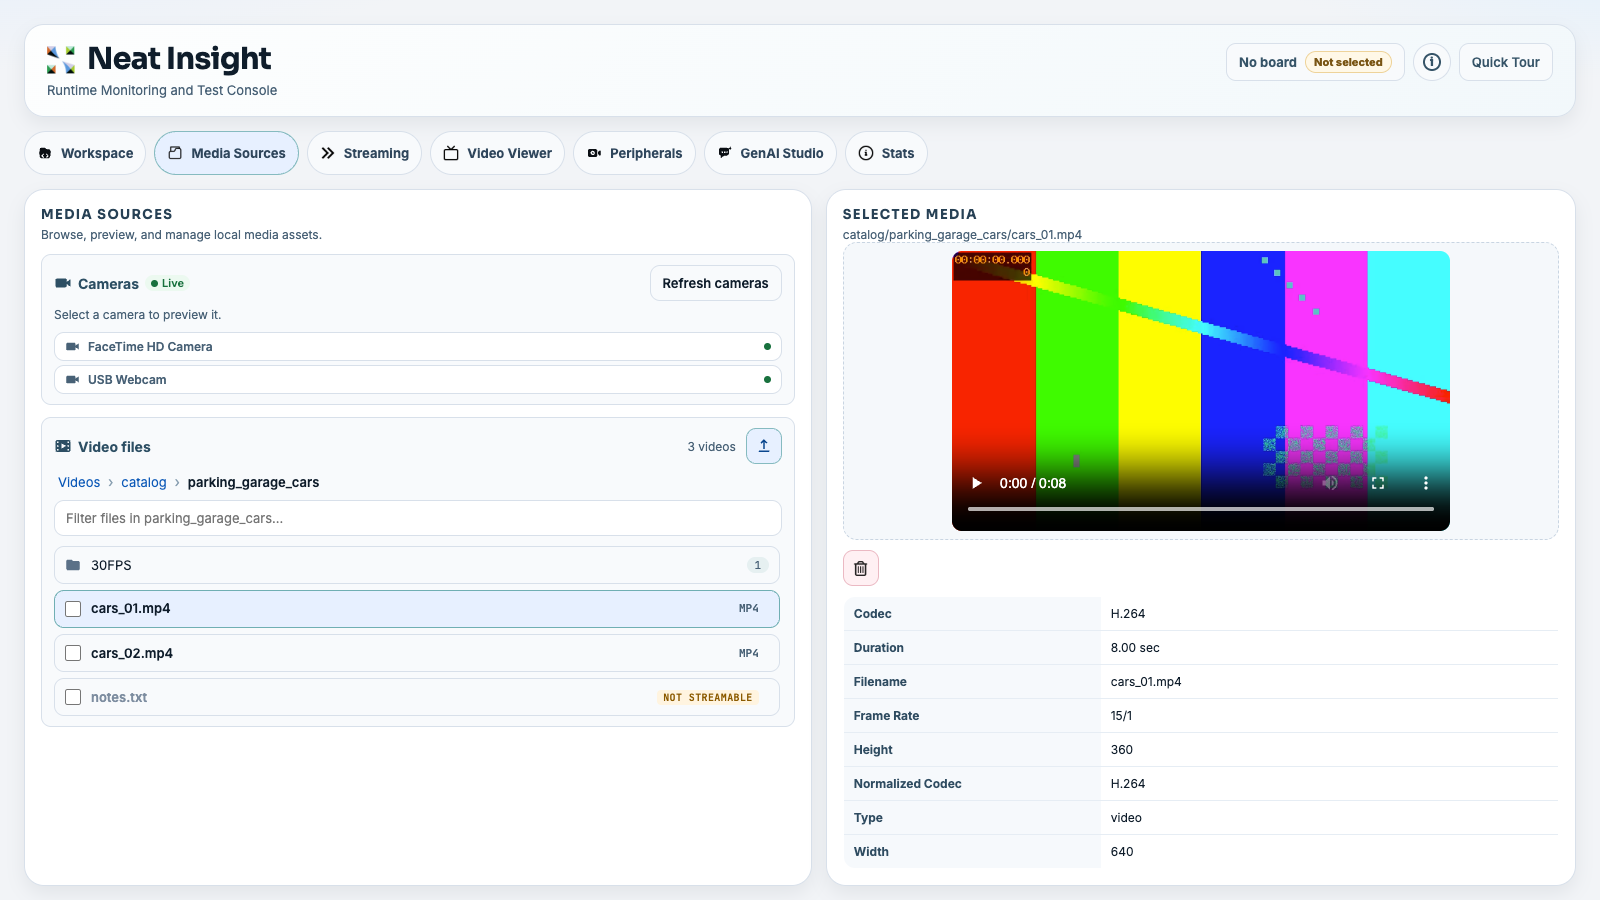
Media Sources combines importing, file selection, preview, metadata inspection, and delete actions in one view. Imported catalog assets are stored under catalog/, and YouTube clips are stored under youtube/, so you can identify how files entered the library.
Preview a camera
A webcam or phone camera connected to the computer running your browser can be previewed here before you stream it. Under Cameras, select Enable camera access and allow access when the browser asks; your cameras are listed below the button. Select a camera to show its live video in place of the selected file, with the camera's name and what the browser reports about the stream:
- Active stream: the resolution and frame rate the camera is sending now, and whether that is the camera's own mode or the browser crops or scales it.
- Camera capabilities: the largest width, the largest height and the highest frame rate the camera reports, each on its own. These are limits, not a mode the camera has: a camera that reports 1920 for both width and height need not capture 1920×1920.
A value the browser does not report is left out. Browsers do not report the pixel format, so it is not shown.
The preview stays in your browser. It does not assign a Streaming slot or start or stop a stream; to stream the camera, assign it to a slot in Streaming (see Use a webcam as a source below). If this browser tab is already publishing the camera, the preview shows that capture instead of opening the camera again, so the stream's settings do not change. Selecting another camera or a file, Stop preview, leaving Media Sources, or closing the tab releases the camera.
If a camera cannot be previewed, the panel says why:
| What you see | What to do |
|---|---|
| Camera permission was denied | Allow camera access for the Insight site in your browser settings, then select Try again. |
| The camera could not be started | Another application is using the camera. Close it, then select Try again. |
| That camera is no longer available, or The camera stopped sending video | The camera was disconnected. Reconnect it, then select Refresh cameras. |
| This page is embedded in a frame that does not allow camera access | Insight is shown inside another page, such as an editor tab, that does not pass camera access on to it. Open Insight in its own browser tab. |
Streaming Sources
The Streaming Sources view turns uploaded media files into live source slots. Each source slot can expose an RTSP URL:
rtsp://127.0.0.1:8554/src1
rtsp://127.0.0.1:8554/src2
rtsp://127.0.0.1:8554/src3
Those URLs are correct for applications running in the same SDK container as Insight. If the application runs on a DevKit or another external machine, use the SDK host IP address and the mapped rtsp.tcp host port from neat --json.
Insight selects codec and transport options from the assigned media:
- H.264 media streams over RTSP as H.264.
- HEVC/H.265 media streams over RTSP as H.265.
- MJPEG media can stream over RTSP as MJPEG or over HTTP as multipart MJPEG.
The codec is determined by the selected media and is not manually changed in the UI. MJPEG over RTSP is encoded into RTP-compatible MJPEG, while HTTP MJPEG can preserve MJPEG frames for camera-style HTTP testing.
Select the file field of a source row to open Source for srcN. Its Video file tab has the same folder browser as Media Sources; pick a video, then Assign, or Clear to unassign. Its Camera tab assigns one of your cameras instead, and its Stream URL tab pulls a network stream (see below). You can start and stop individual sources, auto-assign unique files across source slots, bulk start sources, stop all streams, and copy stream URLs for use by applications or test harnesses.
This view is useful when you need repeatable input streams for an object detection, segmentation, tracking, classification, or GenAI vision application.
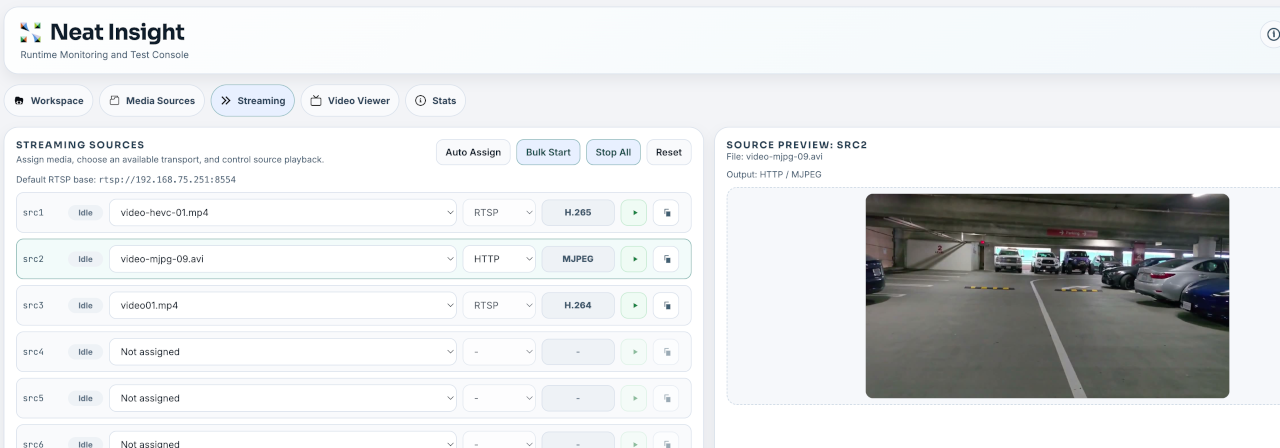
The Streaming Sources view lets you assign media files to source slots, start or stop streams, copy the active stream URL, and preview the selected source before wiring it into an application.
Use a webcam as a source
A webcam attached to the computer running your browser can be used as a live source, so you can test an application against a real camera without copying a file onto the board first. To check a camera first, preview it in Media Sources (see Preview a camera above).
- Select the file field of a source slot and switch the Source for srcN dialog to Camera.
- Select Enable camera access, there or under Cameras in Media Sources. The browser asks for camera permission; Insight cannot grant it for you. After you allow access, your cameras are listed in the tab.
- Select a camera, its Resolution and Bitrate, Assign it, then select Start. The row shows a
[CAM]badge (video files show[VID]), the browser publishes the camera to Insight, and the slot reportsLive. - Use Copy URL to get the RTSP URL and point your application at it, exactly as you would for a file source.
Resolution asks the camera for 1920x1080 at 30 fps by default. You can instead choose another size and rate, from 3840x2160 down to 640x480 and up to 60 fps, or Camera default. The list shows only the modes within the largest size and frame rate the camera reports. A camera without the chosen mode sends its nearest one. When the computer or network is busy, the browser keeps the size and lowers the frame rate. Bitrate sets the highest rate the browser sends the camera at. Auto scales it with the resolution, 8.1 Mbps at 1920x1080 and 30 fps, or you can choose 2 to 32 Mbps. Insight re-encodes the camera for the stream URL, so the stream's bitrate can differ. To change the resolution or bitrate of an assigned camera, open the dialog again, choose another Resolution or Bitrate, select Assign, then Start.
The camera list updates as cameras are connected and disconnected. Webcam sources publish video only, as H.264.
The preview beside the source list shows your local camera feed while capture is active. It is not the video the board received, and it does not show the delay that a receiving application sees; if publishing fails, capture stops and the preview clears.
Selecting Stop, unplugging the camera, or closing the browser tab ends the stream and returns the slot to Idle. Stop All, Reset and Auto Assign also release every webcam, because each of them takes those slots away: Reset and Auto Assign clear the camera selection as well, so pick the camera again afterwards. The browser tab must stay open while the webcam is publishing: it is the component sending video to Insight. For the same reason, a webcam source is never restored as Live after Insight restarts — reselect the camera and start it again.
If starting a webcam fails, the message names the cause:
| What you see | What to do |
|---|---|
| Camera permission was denied | Allow camera access for the Insight site in your browser settings, then re-enable camera access under Media Sources → Cameras. |
| That camera is no longer available | The camera was disconnected. Select Refresh cameras and reselect it. |
| The camera could not be started | Another application is using the camera. Close it and retry. |
| Could not reach the webcam publish endpoint | The browser could not reach the publish listener. Trust the webrtcWhip endpoint's certificate (open its URL once to accept it) and confirm the port is reachable (see Ports and Network Behavior). |
| Webcam publish was rejected | Insight could not accept the stream. Confirm the webrtcWhip port is reachable (see Ports and Network Behavior) and that your browser trusts the Insight certificate. |
Browsers only allow camera access on pages they consider secure. If Enable camera access does nothing, open Insight over HTTPS and trust its certificate first; see Install and Upgrade.
External streams
Any RTSP, WebRTC (WHIP) or SRT tool can publish directly to a source slot, for example ffmpeg capturing a camera on the host:
ffmpeg -f v4l2 -i /dev/video0 -c:v libx264 -preset veryfast -tune zerolatency -g 30 -pix_fmt yuv420p \
  -f rtsp -rtsp_transport tcp rtsp://<insight-host>:8554/src2
The SDK container maps the RTSP port (8554) and the WHIP port (webrtcWhip, 8889); SRT publishers must run inside the container or on a DevKit-native install.
Insight shows such a slot as External within about two seconds: the row is read-only, the chip lists protocol, publisher address and, once probed, resolution and frame rate. The codec cell turns amber with a warning when the stream uses a codec Neat pipelines cannot decode (anything other than H.264, H.265 or MJPEG). Copy URL stays available; applications keep reading rtsp://…/srcN as usual, regardless of the publish protocol.
Whoever publishes first holds the slot. Starting a file on an External slot, or publishing to a slot Insight is already streaming, is rejected instead of silently replacing the running stream. Take over — the square stop glyph in the External row — disconnects the external publisher (and its readers) after a confirmation; the slot returns to Idle with its previous file assignment. A publisher that reconnects automatically may re-take an idle slot, so stop the external tool first when you want to reuse the slot for a file.
The Source Preview panel can show an External slot live at the source's own frame rate; the preview is off by default (remembered per browser) and decodes nothing while off. After selecting another external slot, a "Connecting" indicator is shown until the first frame of the new stream arrives. That wait is mostly the time until the publisher's next keyframe, so give streams you intend to preview a keyframe interval of about a second (-g 30 at 30 fps in the example above; encoder defaults are often several seconds). Inside the SDK container, publishers and readers outside the container appear with the Docker bridge address rather than their real IP.
Auto Assign, Bulk Start, Stop All and Reset never touch an External stream; the result message lists which slots were skipped. Reset still clears the stored assignment of every slot, External ones included.
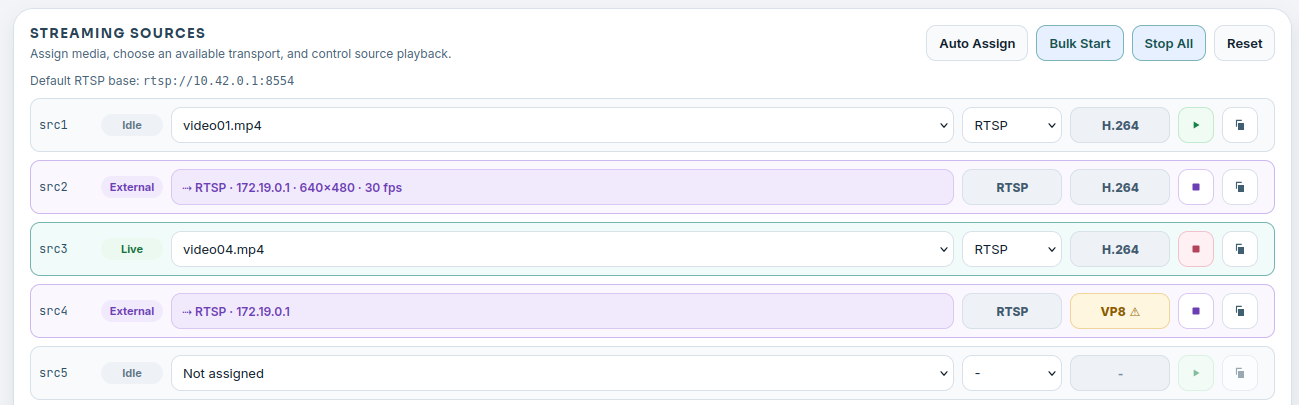
External slots show the publisher, its address and the probed stream format; the codec cell turns amber when Neat pipelines cannot decode the stream.
Pulled streams
A stream that already exists on the network, typically an IP camera, can be pulled into a slot. Click the file button of an Idle slot, switch the dialog to Stream URL, enter the camera's rtsp:// or rtsps:// URL and, if the camera needs them, its username and password, then press Pull. Insight configures mediamtx to pull the stream and forward it unchanged to rtsp://…:8554/srcN; nothing is decoded or re-encoded, and applications read the slot like any other.
The row shows Pulled in teal once frames arrive, with the source host, resolution and frame rate in the chip and the codec in the codec cell. Before that it shows Connecting…. If the camera cannot be reached the row turns amber, Unreachable, with the reason; mediamtx keeps retrying and the row returns to Pulled by itself when the camera is back. If the camera rejects the username or password when you press Pull, the dialog shows the message and the slot is unchanged. The row shows Auth failed in red only if the camera starts rejecting the credentials later, for example after it was unreachable at first, and stays there: press Stop and pull again with the right credentials. A password is only ever kept in memory; Insight never writes it to disk, shows it again, or logs it, and a pulled slot is not restored after Insight restarts.
Stop on the row releases the pull and the slot returns to Idle with its previous file assignment. Assigning a file, starting, or taking over a pulled slot is rejected. Stop All and Reset stop pulls too, since Insight started them, and leave only External streams running. Auto Assign and Bulk Start skip pulled slots like External ones and list them in the result message.
The Source Preview panel works for pulled slots exactly like for External ones (preview off by default). An rtsps:// camera with a self-signed certificate is reported as unreachable with a certificate message in this release.
Frame rate
The Source Preview panel shows an FPS control under the file name of the selected source, and the row notes the chosen rate next to the file once it is set. When you assign a video, the control shows the frame rate detected in the file. Use the − and + buttons to change it in steps of 5, or type any whole number from 1. Native sets the source back to the file's own frame rate. While a source streams at its native rate, the rate next to the file and the rendition hint are greyed out. A rate the encoder cannot reach at the file's resolution (beyond the highest H.264 or H.265 level) is refused when the source starts, with a message naming the limit.
When the value differs from the file's native frame rate, starting the source first creates a rendition: a copy of the video re-encoded at the requested constant frame rate with the same encoding rules as the Insight media catalog (H.264 baseline or H.265 main, yuv420p, no B-frames, one reference frame, a closed one-second GOP). The row shows Encoding with a progress bar in the preview panel, then goes Live streaming the rendition. Renditions are stored under .renditions/ in the media directory and recorded in renditions.json, so the next start — including after restarting Insight — reuses them instead of encoding again. Replacing a source file with different content invalidates its old renditions. Deleting a source file removes its renditions. Byte-identical files (for example a copy under another name) share one rendition, which stays until the last of them is deleted or replaced. If encoding fails, the source file is untouched and no partial rendition is kept.
Insight encodes one rendition at a time. While another rendition is being encoded, the preview panel shows Waiting for another rendition to finish encoding… and the encode starts as soon as the other one is done. Before encoding, Insight checks the free space in the media directory: it needs the rendition's expected size plus 1 GB to spare, and otherwise the start fails with a message saying how much space is needed. Clear renditions or free up space, then start the source again.
MJPEG sources cannot change frame rate; the control is disabled for them.
Clear renditions in the Streaming Sources toolbar deletes every cached rendition (except ones a playing source is using); they are re-created on the next start.
Video Viewer
The Video Viewer displays low-latency WebRTC streams from the video forwarder.
For channel N:
video:    UDP 9000 + N
metadata: UDP 9100 + N
For example, channel 0 uses video UDP 9000 and metadata UDP 9100; channel 1 uses video UDP 9001 and metadata UDP 9101.
If the sender runs on a DevKit or another external machine, use the mapped videoUDP and metadataUDP host port ranges from neat --json. The channel math is the same, but the starting ports may be different.
The viewer can render metadata overlays for common vision outputs, including object detection, classification, pose estimation, segmentation, and tracking. Each metadata type has a Show Overlay switch, so its output can be hidden without changing confidence thresholds or styles. Pose Estimation also lets you show or hide joint markers and opt into landmark names; names are hidden by default to keep a full-body pose readable. The viewer can also show frame-correlated data in a separate per-channel auxiliary panel; the built-in BlazePose 3D view is the first renderer. Multiple auxiliary views appear as tabs, and the panel can be collapsed, expanded, or hidden. See Auxiliary Visualizations for the protocol. Viewer settings let you tune overlay behavior such as confidence thresholds, ROI display, tracking history, and synchronization buffering. When a video frame has no metadata of a type, for example because inference runs slower than the video, the viewer keeps drawing that type's last overlay for up to 200 ms; a new message of that type replaces it, even one with no objects. Metadata timestamps use source PTS milliseconds and are omitted when unavailable.
A channel that receives JPEG (RTP payload type 26) is shown the same way. Insight relays each JPEG frame to the browser unchanged, the tile status reads JPEG, and overlays follow the same timestamps. Like H.264 frames, each frame is held for the Video Sync Buffer time so its overlays can arrive first. The ROI editor preview does not show JPEG channels yet; it reports that they can be viewed only in the Video Viewer.
The General settings tab has an Orientation setting: None, Mirror, Flip Vertical, or Rotate 180°. It turns the picture and its overlays, including their labels, in the viewer only, for every codec. The stream and the metadata coordinates are unchanged.
Global and channel settings
Viewer settings exist in two scopes. The settings button of the viewer page opens the global settings. The button at the right end of a tile's status bar opens the settings of that channel; the dialog's title names the channel.
A channel follows the global settings. To give a channel its own value, open its settings, switch on Own value next to the setting, set the value and select Save. A value that a channel sets itself takes precedence over the global value. Switching Own value off again makes the channel follow the global value. Class colors work per entry: the channel's dialog shows the global entries as from global, and Override copies one into an entry of the channel.
In the global dialog, an amber warning icon at the end of a setting's row marks a setting that channels set themselves; its tooltip says how many. Select the icon to list those channels with their values. Use global value removes a channel's own value at once, without Save. Reset all channels to the global settings… removes the own values of every channel after a confirmation; regions of interest are kept.
Settings are stored in the browser. They are not shared between browsers or machines.
Metadata colors
Overlays pick colors from one shared palette of 40 colors so that different identities stay apart on a crowded frame. The first 20 colors are the most distinct; the other 20 are only used when more than 20 identities need a color at once: classes across all channels, or tracks or poses on one channel. Each metadata type defines what identity means:
| Metadata type | Colored by | Parts that share the color |
|---|---|---|
object-detection | class label | box, label, confidence |
segmentation | class label | mask, outline, box, label |
classification | class label | each label line |
tracking | track id | box, label, history trail |
pose-estimation | pose id | keypoints, skeleton, keypoint names, box, label |
A color is allocated the first time an identity appears. Class labels share one allocation across all channels, so bicycle has the same color on every tile and person looks the same in detection, segmentation and classification. Overrides are per metadata type: an object-detection entry for person does not recolor person in segmentation or classification. Tracks and poses are allocated per channel, because an id is only unique within one stream; their colors start over when the channel reconnects. An identity keeps its color while it is on screen on any channel. Once it has been gone for more than 5 seconds, its color can be handed to a new identity. When more identities are on screen than the palette holds, new identities share the color of the one drawn longest ago rather than taking a color from anything visible.
Tracks and poses without an id draw in one neutral color. Senders that want per-person or per-track colors must include id.
Object detection and segmentation settings hold optional per-class overrides. An entry for a label fixes that class's color and line style. An entry labelled default fixes the color of every class without its own entry. Without any entries, all classes are colored automatically.
Line Width on the General tab sets how wide every overlay line is drawn: detection boxes, segment outlines, track boxes and trails, and pose skeletons. It is 3 px by default and can be set from 1 to 10 px. A per-class entry's Thin or Thick still sets the width for its own class. Like the other settings, a channel can use its own value.
Late metadata
An overlay is drawn only if its metadata has reached the browser by the time the video frame is shown. The viewer holds video back by the video sync buffer (300 ms by default) to give metadata that time. An application that sends metadata later than the buffer allows loses its overlays, even though video and message rate look healthy.
When at least half of the recent messages arrive after their frame, the tile shows a Metadata late chip in its status bar. Select it to see:
| Value | Meaning |
|---|---|
| Arrives after its frame | How long after the frame was shown its metadata arrived, as measured by this browser. |
| Video sync buffer | The buffer in effect for this channel. |
| Late messages | Share of recent messages that arrived too late to be drawn. |
The panel offers two ways to raise the buffer to a value that covers the measured lateness:
| Button | Effect |
|---|---|
| Raise for this channel to N ms | Sets the video sync buffer of this channel only. Other channels keep their setting. |
| Raise globally to N ms | Sets the global video sync buffer. It applies to every channel that has no value of its own. If this channel had its own value, that value is removed. |
| Use global value (V ms) | Shown instead of Raise globally to N ms when the global video sync buffer already covers the measured lateness. Removes this channel's own value; the global value is not changed. |
The video of every affected channel is delayed by the additional time. The viewer never changes the buffer by itself, and the panel never lowers the global buffer. After a change, the viewer waits a few seconds before it judges lateness again, because the browser moves to a larger buffer gradually.
The chip disappears once fewer than a tenth of the messages are late. If the buffer needed would exceed the maximum of 4000 ms, the panel offers no button: the application has to send its metadata sooner. If the lateness could not be measured, because the metadata does not belong to the frames that were shown, the panel says so and offers no button either.
Applications that forward the encoded input stream unchanged and send metadata only after decode and inference are the typical case, because their video does not wait for inference.
Use the Video Viewer to confirm:
- The application is sending video to the expected channel.
- Metadata is arriving on the matching metadata channel.
- Overlays align with the video frame.
- Auxiliary views clear and update with the corresponding video frame.
- Browser playback is healthy.
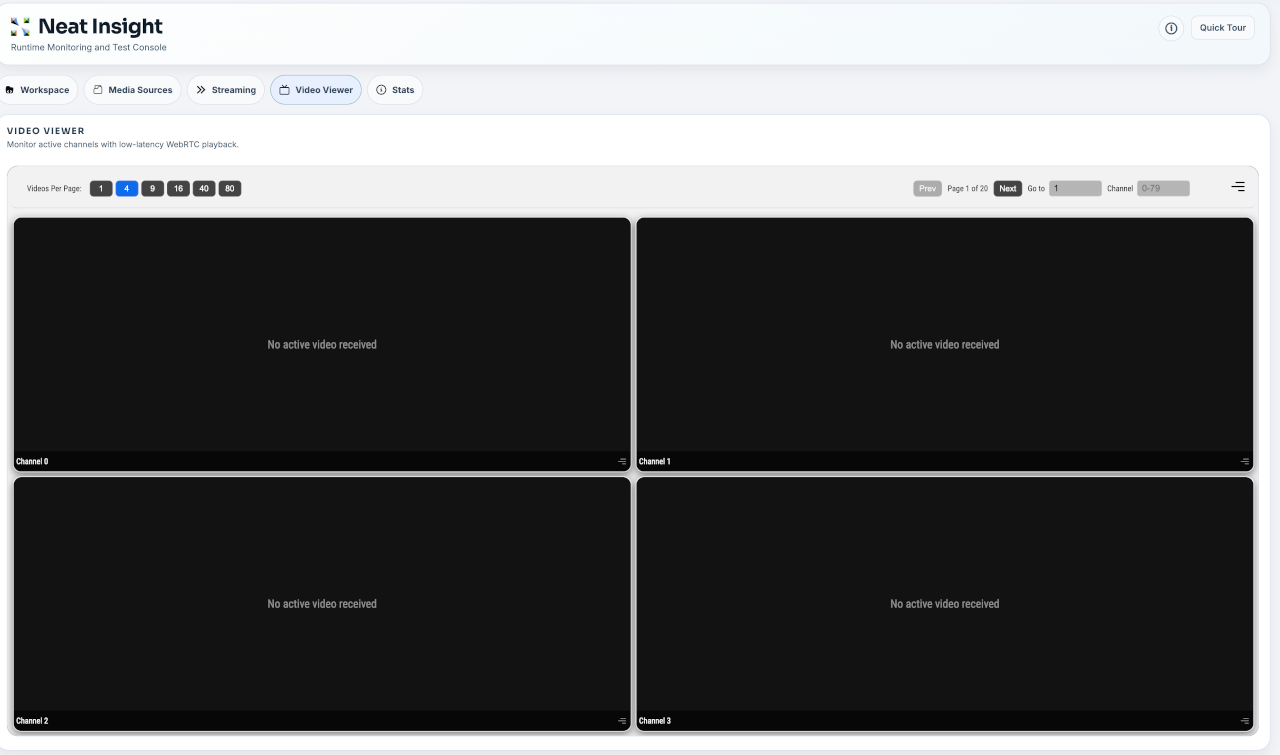
The Video Viewer can show one or more channels at a time, with pagination and channel selection controls for larger multi-stream tests.
Peripherals
Peripherals lists the cameras and microphones connected to a board and shows what each one reports. SiMa Sentinel on the board discovers them; Insight reads Sentinel's catalog. Discovery reads device information only: it never opens or streams a device, so devices stay available to your applications. Only a camera preview or a microphone test opens a device, and only while it runs.
Selected board
Insight works with one selected board, shown in the header. Select it to open the board settings, where you can change the board, test the connection, or trust a reflashed board's host key. Peripherals and Stats use this selection.
The board is chosen in this order:
- A board you entered: open the board settings and give its address, SSH port, and user. Use default returns to the automatic choice.
- Insight installed on the board: Insight inspects the board it runs on.
- Neat SDK: the DevKit paired with
sima-cli sdk setup --devkit <ip>.
Insight connects over SSH with the keys of the account that runs it. It never asks for or stores a password. If authentication fails, the page shows the ssh-copy-id command that authorizes a key on the board. After a board is reflashed it presents a new SSH host key; Insight refuses to connect until you compare the fingerprints and select Trust new key.
Cameras and modes
Select Refresh to scan the board: Insight asks SiMa Sentinel to rescan and waits for the result. Sentinel finds MIPI cameras through the media graph and the ISP, and USB cameras through V4L2. If Sentinel is not installed, not running, or too old to report peripherals, the page says so; install or update it with sima-cli neat install sentinel. For each camera the page shows the identity, connection, device identifier, and the pixel formats and resolutions the camera reports. No camera's resolutions show a frame rate: a MIPI camera's rate depends on the sensor mode it is running in, so it is not known before the camera runs, and the page treats every camera the same way. Insight does not set frame rates. Each mode is in one of three states, and the pixel format and resolution menus group their entries under them:
| State | Meaning |
|---|---|
| Available | For a MIPI camera, the board's camera overlays support the camera's sensor, the ISP outputs the mode's size, and its pixel format is NV12. For a USB camera, SiMa Sentinel reports the mode in MJPEG on the uvcvideo driver, which Neat's USB camera input reads. |
| Unverified | On a board whose ISP takes the sensor's sizes at run time (Platform 3.0), an NV12 size of a supported sensor that SiMa Sentinel cannot confirm libcamera streams exactly, because libcamera may crop it from a larger mode. It can be selected and previewed to check; it is never preselected. |
| Unsupported | Any of those fails. A USB camera's other modes are Unsupported with SiMa Sentinel's reason (another pixel format, or another driver), and a mode Sentinel gives no verdict is Unsupported because Sentinel could not tell; a Sentinel too old to check USB cameras leaves every USB mode Unsupported and says to update it. For a MIPI camera the reason says which: the sensor is not in the board's camera overlays; the ISP cannot output the size; the format is not NV12; or, on a board whose ISP takes the sensor's sizes at run time (Platform 3.0), the size is wider than libcamera streams (4032 pixels on the IMX477). A Sentinel too old to report the board's camera overlays leaves every mode Unsupported until you update it. |
SiMa Sentinel decides each mode's state and gives its reason; Insight shows that answer. With a Sentinel too old to decide, Insight applies the same rule to a MIPI camera's modes in Sentinel's catalog. Only a Sentinel that reports a USB camera's driver checks USB cameras; with an older one, including one that decides MIPI modes, every USB mode is Unsupported until you update Sentinel. The overlay check matches the sensor Sentinel links to the camera in the board's device tree against the sensors the overlays installed under /boot support. The NV12 condition is a fixed fact about Neat's CameraInput, which outputs NV12; Insight does not query Neat on the board. Every detected camera shows a Connected pill and its state: Available when any of its modes is, otherwise Unverified when any of its modes is, otherwise Unsupported; an Unverified or Unsupported camera's panel says why. Insight does not say whether another program is using a camera.
Open Camera ID next to the camera's name to see and copy the ID a Neat application opens the camera by (CameraInput for MIPI, UsbCameraInput for USB).
Preview a camera
Select Start preview to see what a camera sees. Insight runs a GStreamer pipeline on the board over its existing connection: it captures the selected mode (libcamerasrc for a MIPI camera, v4l2src for a USB camera), scales it to at most 640 pixels wide at up to 15 fps, and sends JPEG frames back, which the page shows as they arrive. Nothing else on the board is needed beyond GStreamer itself; if gst-launch-1.0 is missing, the preview names the packages to install (gstreamer1.0-tools, gstreamer1.0-plugins-base, gstreamer1.0-plugins-good, and gstreamer1.0-libcamera for MIPI cameras).
A preview holds the camera, so your application cannot open it until you stop the preview. Insight will not start one on a camera another process is already using, and it never stops that process for you. Capture stops when you select Stop, leave the page, refresh the scan, or change the selected board. A closed browser stops it too. If Insight stops or restarts, the board pipeline exits at its next frame, once its output connection has closed; after a silent network loss it can hold the camera until the board's SSH connection times out. To clear a preview that still holds the camera, select Stop while the page still shows it, wait for that timeout, or end the gst-launch-1.0 process on the board.
A MIPI camera previews its Available and Unverified modes. On a board whose ISP takes the sensor's sizes at run time (Platform 3.0), a size the sensor lists may still not be one libcamera outputs; the preview then names the size libcamera streams at so you can pick it. A USB camera previews any mode it lists in MJPG or a raw format such as YUYV, whether or not the mode is Available. Insight opens it by its stable /dev/v4l/by-id path when the board has one; otherwise it first asks SiMa Sentinel whether the camera's /dev/videoN node is still the same camera, and asks you to Refresh when it is not.
While a preview runs, the mode beside it shows the camera's frame rate, which can be faster than the preview's 15 fps. The preview asks the camera for the selected mode's rate. For a USB camera the rate shown is that mode's rate. For a MIPI camera it is the most the sensor delivers in this mode, shown as "up to", which Insight asks SiMa Sentinel for once the first frame arrives, so it appears a few seconds after the picture; if Sentinel cannot report it, no rate is shown.
Camera setup
A Sentinel that reads the board's device tree also reports how the board is set up for cameras. After a Refresh, the board settings show the board Model and a Camera setup line naming the overlays the board loads that configure a camera sensor. With an older Sentinel, these details do not appear.
Microphones
Refresh also lists every ALSA capture device SiMa Sentinel reports, USB or on-board. For each microphone Insight shows its name, the ALSA device name to open it with (for example hw:CARD=Nano,DEV=0), and, for USB audio devices, the sample formats, channel counts, bit depths, and sample rates it captures. On-board sound cards do not report these, and the page says so.
Discovery never opens a sound device: Sentinel reads /proc/asound and sysfs. A USB microphone keeps the same identity when it is unplugged and plugged back into the same port, even when its card number changes; in another port it is a different microphone.
To hear a microphone, select Test microphone and speak; the level meter shows what the microphone hears. Select Stop recording when you are done (a test stops by itself after 30 seconds), and Insight plays the recording back in the page. Stop playing ends the playback. If the recording stays below about -60 dBFS, the page says nothing was picked up; check the microphone's mute button and gain. Only the test opens the device, and only while it records. Before recording, Insight re-reads Sentinel's catalog and records only from the device Sentinel names; if the board's devices changed since the last scan, the page asks you to refresh first. If another application has the microphone open, the test is refused and that application is left alone. Insight does not configure audio input: Core has no audio input.
Stats
Stats reads the board's own telemetry from Sentinel, the simaai-sentinel daemon, so you can separate application behavior from device behavior. A dropped frame may come from the stream path, but it may also correlate with board power, on-die temperature, CPU load, or memory pressure.
Stats works on the selected board, chosen in the same Board panel the Peripherals page uses.
Sentinel daemon
The page first reports whether Sentinel is installed and running on that board, and its version. When it is missing, select Install Sentinel: Insight runs sima-cli neat install sentinel on the board itself, which needs sima-cli there and passwordless sudo. When either is missing, the page names the command to run in a shell on the board instead. An installed and running daemon is never reinstalled from here, because the installer restarts it and would end a trace in flight.
An install that is refused or fails is reported as an install rather than as a failed read: the page says the install did not happen, gives the board's own sentence for why — no sima-cli, no passwordless sudo, an installer that exited non-zero, or one that finished with the service still down — and keeps the installer's output behind Installer output.
Live metrics
The DevKit view is laid out like Sentinel's own terminal dashboard (simaai-sentinel ops). A status line shows whether the readings are live and when the current Sentinel session started, which is what the session average and peak cover. Export CSV downloads every metric at each sample Sentinel holds for the session (its last 240, about eight minutes; record a trace under Runs for longer), and Pause updates stops polling. Below it are six tabs:
- Overview: charts of the hottest temperature sensor, board power, CPU usage, Linux memory, accelerator memory (MLA and EV74 stacked), and network traffic, with All metrics folded beneath them, every metric in Sentinel's order.
- Thermal: the hottest sensor over time, then each sensor group (MLA, APU, CVU, TOP, Board) as small charts.
- Power: current, session-average, and session-peak power as figures, board power over the window with the session average marked, and the power rails stacked so the top edge is the board total. Board power and energy are estimated: the sum of the SoM regulator rail readings.
- System: CPU & memory charts CPU usage, load average, Linux memory, MLA memory, EV74 memory, and both stacked as accelerator memory. Per-core CPU is a heatmap of load, a row per core and a column per 10 seconds of the window in one blue, with each core's one-minute average and the busiest core; an average past a core's limits turns amber or red.
- Storage & Network: eMMC use, network receive and transmit, eMMC reads and writes, and their metrics.
- Runs: record a trace, and open, compare, or delete saved runs. Comparing overlays one series (total power, thermal maximum, CPU, load, RAM, MLA memory, or EV74 memory) for every selected run over the time they all cover, on a scale fitted to the runs, with each run's minimum, mean, median, P95, maximum, change against the baseline, and energy; the per-metric comparison is folded beneath it.
Charts use fixed scales (percentages 0-100, temperatures 40-90 °C, anything else up to a round number above its peak), show the warning and critical levels Sentinel defines, and read out every series at a point when you hover. Colour means status: a chart is blue until its reading passes a warning or critical level, then amber or red. A tab's name is marked when a metric in it is past a threshold. A metric the board cannot measure reads as an em dash, never as zero.
Charts cover the whole window Sentinel keeps, 240 samples (about eight minutes): on the first read of a board, and again after a pause in polling of more than a minute, Insight takes them from Sentinel's own cache, then adds a sample every two seconds while the tab is open and visible. Polling also stops when the browser tab is hidden or the view is left.
If the board stops answering while you are looking at it, polling stops and the panels stay, holding the last values read and the board's own explanation of what failed, rather than emptying the page. Selecting a different board is not the same thing: that clears everything first, so one board's numbers are never shown under another board's name.
Traces and runs
A trace records every sample around a workload. Name it, optionally add a note and tags, and select Start trace; Stop trace saves it as a run on the board. Sentinel records one trace at a time and refuses a name a saved run already uses. Saved runs are listed with their state, start time, duration, the energy Sentinel measured over the run, and sample count, and survive a daemon restart. Open a run to see it summarised: every metric it recorded, with the label, unit, group and thresholds that were in force at the time, and the smallest, largest and mean value over that run's samples. A metric that crossed its warning or critical threshold at any point in the run is marked. A run that caught only one sample is reported as the moment it was taken rather than as a range from that moment to itself, and its mean, minimum and maximum are named as the single value they all are. The run's metadata — its name, note, sample interval, Sentinel version, and the board it ran on — sits below that.
Ticking a run shows a toolbar with how many are selected and what can be done with them. Select two to eight and Compare to put the metrics in rows and the runs in columns. Sentinel measures the comparison against one baseline run, which is marked in the header along with each run's note; every other cell shows that metric's mean over the run with its percentage change against the baseline beside it. A change too small to print shows as “<0.01%” rather than as no change at all.
Where a cell shows “—” in place of a change, Sentinel withheld one, and the table says which of its reasons applies rather than leaving one em dash to stand for all of them. Hover, tab to or tap a “—” to see its reason beside it; a screen reader reads the reason with the dash. The reasons are:
- Sentinel publishes no change for it. Run totals — duration, energy and sample count — are reported per run without a percentage.
- The baseline measured 0, and there is no percentage change from 0. The baseline did measure the metric; there is simply no percentage from zero. This is common for per-core CPU usage on an idle baseline, and it is where the change is often largest: a core that averaged 0% in the baseline and 5.9% in the other run shows “—” here, so read the two values rather than the change.
- The baseline run has no value for that metric. The only case in which the baseline never measured it.
- This run has no value for that metric. Where a run was listed but Sentinel summarised nothing for it, the whole column reads this way and is called out above the table.
Run totals are shown in the units the rest of the view uses: a duration Sentinel reports in milliseconds reads in seconds, and energy in joules.
If a run is deleted on the board while it is selected, its row leaves the list and there is no longer a checkbox to clear it with, so every comparison fails on it. Insight names any selected run Sentinel no longer lists and offers to drop it from the selection.
Opening and comparing runs has a size limit. Insight reads at most 12 MiB of Sentinel's answer from the board, and a saved run carries every sample it recorded, one every two seconds. A run longer than about three hours cannot be opened, and runs whose lengths add up to more than about three hours cannot be compared together. Insight then says the answer was too large to read. Record shorter traces for runs you want to open or compare.
A comparison asks for its runs as one comma-separated list of names, so a trace name cannot contain a comma: the request would be read as two runs the board does not have, and fail naming a run nobody selected. Insight refuses such a name when you start a trace, and names any already-saved run that carries one rather than letting Compare fail on it.
Values from a board you have left
Reading a board takes an SSH round trip, so an answer can arrive after you have selected another board. Selecting it cancels everything still on its way from the previous board: the new board is checked at once, and a late answer from the old one is dropped rather than shown as the new board's. Stop trace names the board its trace was read from, and is refused rather than stopping a trace on another board. When the selected board changes somewhere else — another browser tab, or an API client — the values already on the page are labelled with the board they came from, with a way to read them again.
Insight host
Below the runs, a compact panel reports the machine Insight itself runs on — the SDK container, or the board Insight is installed on — from /api/metrics: CPU load, memory, disk, and a temperature where the platform exposes one. It answers a different question from the board telemetry above it, such as whether the container is running out of disk, and it is read every 15 seconds rather than every two. When the legacy REMOTE_DEVKIT configuration is set, this panel reports that connection instead, and says so. When the endpoint answers with no reading at all, the panel says that rather than listing its labels against em dashes.
NEAT profiling timeline
Last on the tab, the profiling timeline plots numeric fields from the profiling events Insight streams from a running application. It is independent of Sentinel: it measures the application, not the device.
GenAI Studio
The GenAI Studio view runs language, vision and speech models on a board. It talks to GenAI Studio from Neat Apps, which runs on the board in backend-only mode; Insight relays every call, so the browser never connects to the board directly.
GenAI Studio runs on the board. The tab can install, prepare and start it, as described below; to start it from a shell on the board instead, run this in the GenAI Studio application directory:
./run.sh
While the tab can't reach or use GenAI Studio, it shows only the setup page for the board Insight is connected to (the board in Insight's header): no chat, models or settings until a usable GenAI Studio answers. The page lists three steps, each with a short status: Install Neat Apps (NEAT_APPS_SKIP_DEPENDENCIES=1 sima-cli neat install apps, which keeps the installed Core and Insight; an Insight built from develop or any branch other than main installs apps@develop), Prepare speech and search (setup.sh, once: about 15 minutes, with internet access on the board) and Start and connect (./run.sh, done once this tab gets GenAI Studio's answer). Its main button is the next thing to do: Install GenAI Studio when it is not installed, Start GenAI Studio when it is installed but stopped, Continue setup, Retry after a failure, or Resume setup after Stop setup. When Insight can't reach the board, the page says the board is disconnected instead; reconnect it in the Board menu, then press Try connection again. The steps run on the board as one job that keeps going when you close the page, and a reload shows where it is. A failed step stays marked, with what went wrong and what to do; a step with no new output for several minutes says so. The board keeps each step's log in ~/.neat-insight/genai-setup/. When setup finishes, the page says GenAI Studio is ready and Open Studio opens the chat. Warnings are folded under the same page with their fixes; after fixing setup's, Run setup again runs setup.sh again and restarts GenAI Studio. Stop GenAI Studio stops it on the board, also when it was started from a shell. Connection settings appears only when GenAI Studio's address needs attention: a custom address, one on another board than Insight's (the page says so), or none. Manage installation in Settings, Connection, opens the page while GenAI Studio runs, to update it, run setup again or stop it, and Back to Studio returns to the chat. A GenAI Studio installed from another channel than this Insight, or built for an older Neat Library than the board has, counts as out of date: the tab says so, also while it runs, and Update GenAI Studio stops it, installs the matching Apps (the previous files move to /media/nvme/.prebuilt-apps-backup; downloaded models are kept), prepares it again and starts it. A GenAI Studio built for another Neat Library build on the same line only lists a warning under the install step.
Setup requires NVMe mounted at /media/nvme. Apps and its Python environments are installed under /media/nvme/prebuilt-apps; download caches and temporary files use /media/nvme/.cache/neat-genai-studio.
The first time the chat opens, also right after setup, a short Tutorial at the top of the page walks through every feature; replay it any time with Tutorial in the header. The header holds the status label, the Model picker with New chat (the pencil) next to it, Read replies aloud, Think first (greyed out for models that always answer directly) and Use my documents, and a toolbar: Export chat, SiMaSentry Solutions (the shield), Benchmark (the gauge), Tutorial, Settings and Full screen.
The status label, and a banner when something needs attention, show the backend's state and what to do next:
- Not set up: no GenAI Studio address is set, and the setup page shows the address field. Enter GenAI Studio's address on the board, such as
https://192.168.1.20:5000. A board entered in Insight's header comes first; otherwise, on a board, Insight defaults to the local backend, and in the Neat Development Environment to the paired DevKit. - Not running: the board does not answer, and the tab shows the setup page: Start GenAI Studio starts an installed one, and the first time the page installs it. Or check the address in Connection settings.
- Error: the board answered with an error, or the address is not GenAI Studio. The setup page shows the board's message, with Connection settings when the address is the cause.
- Starting: the backend answers but its model server is not ready yet.
- Busy: a model is loading. Chat and speech wait until it finishes.
- Incompatible: the board's GenAI Studio API version does not match this Insight. The setup page names the one to update.
- Ready: chat and speech are available. A voice that failed to load on the board is reported here too.
No model yet: when the board has no chat or vision model (or only ones it can't run), the chat says so instead of leaving the message box greyed out. Download Qwen3 VL 4B downloads simaai/Qwen3-VL-4B-Instruct-Autoround-a16w4, a vision-language model, onto the board with its progress under the button, then loads it; the button shows the download size once the board has looked it up, and warns when the board has less free space. Browse models opens Settings, Models at the catalog's search, listing the models the board can download. When the board does not allow downloads, the chat says to set server.hub.allow_download: true in GenAI Studio's config.local.yaml on the board and restart GenAI Studio; when the board can't reach Hugging Face, it says so, and Check again asks again. If Hugging Face has renamed a model, the failed download names the new id and offers to download that instead.
Chat is one conversation in the middle of the page. Type in the message box, or press the microphone, speak, and press it again: your words are transcribed and sent. With a model that sees images, attach a picture, take one with this browser's camera, or take one with a camera plugged into the board: the video camera button lists the board's cameras (/dev/videoN), and Take a picture attaches the board's picture to your next message. The board camera needs GenAI Studio that reports the board_camera feature; on an older one the button is hidden and the camera button's tooltip says why. Replies appear as they are written; the stop button ends one early, and New chat starts over so the model forgets the conversation. Read aloud reads one reply and Stop speaking ends it; Read replies aloud reads every reply, starting with the first sentence while the rest is still being written. The browser asks for microphone and camera permission the first time.
Under each reply, Insight shows how fast it was produced, measured in the browser:
- First token: from sending to the first text of the reply.
- Speed and Tokens: tokens per second and the reply's length. Speed comes from the board when it reports it; otherwise Insight calculates it in the browser.
- Total: from sending to the end of the reply.
- First audio, RTF and Voice, when the reply is read aloud: the time until it started playing, the real-time factor (seconds of compute per second of speech; below 1 is faster than real time), and the speech engine.
- Transcribed and Language, under a spoken question: the time from the end of the recording to the text, and the language heard.
Vision (the eye under the message box) shows the camera as large as fits, at most half the screen's height, with the latest answer and the controls under it, like the standalone GenAI Studio's full-screen vision. Choose This browser's camera or Board camera (the board takes a new picture for each question; Take a picture shows one to aim with), type a question or pick What do you see?, Describe the scene in detail or Read any text in view, then:
- Ask asks once about the current picture.
- Loop asks the same question about a new picture after each answer, one request at a time, with a short pause between answers, until you press Stop. A question edited during the loop is asked from the next picture on. With Read answers aloud on, each answer is read before the next picture is taken.
The loop also stops when the model changes or no longer sees images, the board stops answering or starts another operation, a picture or answer fails (the reason is shown), the board address changes, or you close the view or leave the tab. Vision questions are separate requests without the chat's history, and their answers are not added to the chat. Full screen in the view uses the whole screen; Esc or Close returns to the chat.
Export chat saves the conversation as a .log text file (neat-chat-<date>-<time>.log) with the export time and model at the top, then each turn; pictures appear as [image].
SiMaSentry Solutions opens three demo apps that run on the loaded chat model through Insight: SiMaSentry-Med (clinical chat and medical image review), SiMaSentry-Safe (PPE and hazard checks) and SiMaSentry-Sec (security footage analysis and change detection). Their picture features need a model that sees images. The models run on the board, but voice input inside these apps uses the browser's own speech recognition, which may send audio to an online service (Chrome does). An app's own Home button, Back or Esc returns to the launcher; Close returns to the chat.
Benchmark measures how fast the board's chat models answer: Time to first word, how long you wait before a reply starts, and Reply speed, how fast the reply comes, in tokens per second (a token is about ¾ of a word). The loaded chat model is already chosen, or the first model if none is loaded, so Run benchmark works with no changes; choose more models to compare them. Advanced options holds Runs (1 to 50, default 5), Output tokens (8 to 2048, default 128) and Prompt. A run that has to load a model says so first and names any model it unloads; reload that one from the Model menu afterwards. Each model runs in turn, progress and the reply appear while it runs, and Stop ends it. The results show both numbers for each model, with a label for how they feel in chat: as rules of thumb, under 1 second feels instant and most people read about 5 tokens a second. All numbers lists the average speed, p90 speed, variation, first word time, reply length and runs, with the fastest values highlighted and a line explaining each; Each run lists the runs of the last model. Run again repeats the test, Change models goes back to the choices, and Download CSV and Download JSON save the results.
Use my documents answers from the document database on the board: the board looks up the passages that match each question and adds them before the model answers, and a note under the reply names the sections used (or says nothing matched). Settings, Documents shows what the database holds, uploads a Markdown file (replacing the documents), resets to the default SiMa document, or clears it. View sections lists what was ingested: the source file, the number of sections (chunks) and each section's heading path and text, with Filter sections… to find a passage (up to the first 2,000 sections). Documents need GenAI Studio with document search (the switch is greyed out with the reason otherwise).
Settings opens as a dialog over the chat (its × or Esc closes it) and has four tabs. Manage models at the bottom of the Model menu opens it at Models.
- Models: how many models are on the board, the model in use, how many chat models can stay loaded and the board's free storage, above two lists: On this DevKit, and the Model catalog of models Hugging Face offers the board, which scrolls on its own. Each model shows its type (Chat, Vision or Speech), size and status (In use, Loaded, Loading…, On DevKit, Not downloaded, Downloading to DevKit with its progress, Download incomplete, or Can't run here, with the reason as its tooltip). The first visit fills the catalog; Sync catalog refreshes it in one quick call and doesn't download model files. A model's size and description are read from its card when its row comes into view. This browser saves the list, so search and the type filter work while Hugging Face is out of reach. The catalog also has its own search box, which leaves On this DevKit as it is. Download puts a model on the board; on a board that does not allow downloads the page says how to allow them. Load and Unload change which models are active, with load progress in the banner. The speech model in use can't be unloaded: load another one to replace it. The Model menu chooses which loaded chat model answers. The arrow beside a model shows its description and a link to its model card; Remove from DevKit there removes a downloaded model's files from the board after you confirm. It is offered only for models that are not loaded and not the speech model in use, and the board's reason is shown if it refuses.
- Replies & voice: System prompt is the instructions sent with every chat and vision question. Until you change it, the box shows the default: "You are a helpful assistant. Answer clearly and concisely. Use Markdown formatting when it helps. Answer the question in the language it was asked in." Edit it to replace the default; Reset to default puts the default back, and a box left empty sends the default (an empty prompt is never sent). The tab still adds one sentence saying whether the message has a picture, because small vision models otherwise misjudge that. Longest reply sets the most tokens a reply may have (32 to 2048, default 512, as in the standalone GenAI Studio); it is sent as
max_tokensand does not change the benchmark, which has its own setting. This browser remembers both. Think first and Read replies aloud are the same settings as the header's switches. The voice engine, voice and the language you speak are chosen here too, and the speech recognition model in use is named. - Documents: Use my documents, the document the board searches, View sections, Upload Markdown, Restore default, and Clear documents under Remove documents.
- Connection: where the tab reaches GenAI Studio (port 5000 on the board). The board itself is chosen in Insight's header. Manage installation opens the setup page, and Troubleshooting says how to restart GenAI Studio, with Copy restart commands.
If a model load fails or replies stop, restart GenAI Studio on the board (./run.sh stop, then ./run.sh); that frees the accelerator, and the model can then be loaded again. Troubleshooting in Settings, Connection repeats this.
System Information
The system information panel summarizes the environment Insight can see. In the Neat Development Environment, it can show SDK and component information, Insight status, update information, and exposed port mappings such as mainUI and videoUI.
This is the first place to check when a URL does not match the default port. Insight reads the available port map and uses the mapped videoUI port when opening the viewer. For command-line workflows, neat --json shows the same port-map information.